Stats
Over the Past 15 years income inequality has risen.
In 2005 about 2.37 million people were living in poverty. Some of the reasons were lack of education and the government not spending enough for the communities.
Poverty in Australia since the 1990s has been a major part of spatial inequality. The poverty statistics have been recorded by the Australian Institute of health and welfare (AIHW).
Graph 1
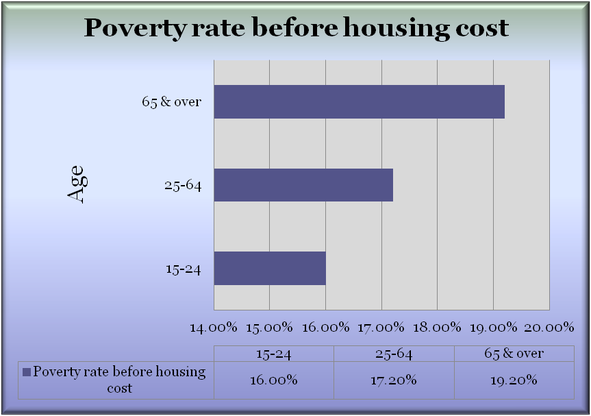

The graph above shows the poverty rate of people ages 15-24, 25-64, and 65 & over before housing costs in Australia from 1989 to 1990. The graph reveals that people aged from 15-24 years old have the lowest poverty rate at 16% before housing costs. The group aged between 25-64 has the second lowest poverty rate among the three 'Groups" at 17.2% followed by the 65 & over age which had 19.2%. An explanation for the graph could be that the 65 and over age group have retired or earn less money during the War times.
It is surprising that the older people have higher rates of poverty compared to the younger ages. The reason for the ages of 15 to 24 having only 16% poverty might be because of the higher income they receive or they could live in families which are quite wealthy and would have more access to better education and facilities. The 25-64 age group have a percentage close to the 15-24 ages at 17.2%. the "middle age group" would have an income which would be able to sustain them but an explanation for the 17.2% of poverty can be that some of them might have less education, gone bankrupt, job unable to sustain them or other reason such as debt.
If I were to find out in more detail about this, I could research on why older people have a higher poverty rate and why younger people don't have as much poverty. I would also research on the income that people earn to further understand this graph and spatial inequality in Australia.
Graph 2
Analysis
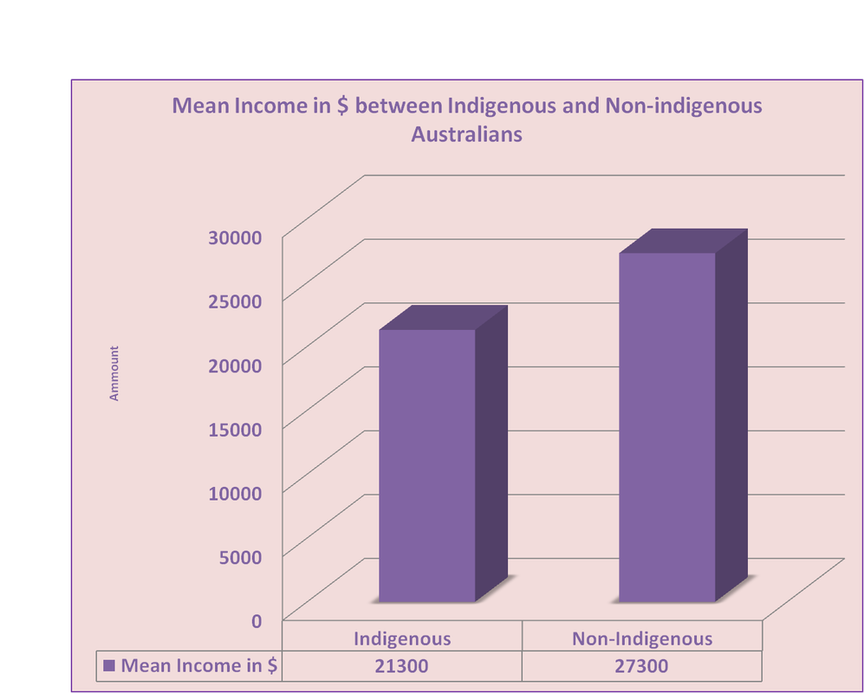
The graph above compares the mean income of Indigenous and Non- Indigenous people in Australia. Part of spatial inequality in Australia is inequalities between indigenous people and non-indigenous because the non-indigenous people have better income and and higher life expectancy which means they have better living standards and income is a major factor. The graph shows that Indigenous people have a mean income $21300 while non- indigenous people have $27300.
From the info of this graph, we can learn that the indigenous people don't get equal pay with non indigenous. A reason for this could be that there are fewer indigenous people and they might possibly have different jobs or are not treated equally .
If I were to find out more information about the stats I would find out why the indigenous people get a lower mean income and the population of indigenous and non-indigenous people in Australia. I could also find out details about the poverty rate, unemployment rate, access to healthcare and types of jobs of both races.
|
http://global-directions.com/images/img_poverty-in-australia.jpg
|
